/projects
End-to-End Data Pipeline with CI/CD and Interactive Dashboard
Complete DataOps workflow: data generation, processing, automated testing, CI/CD, and a Streamlit interactive dashboard deployed to Streamlit Cloud.
Highlights
- Synthetic data generation using Faker and reproducible scripts
- Data cleaning, transformation and feature engineering using pandas and NumPy
- Automated data validation with Pytest integrated into GitHub Actions CI
- Continuous Deployment to Streamlit Cloud triggered after successful CI
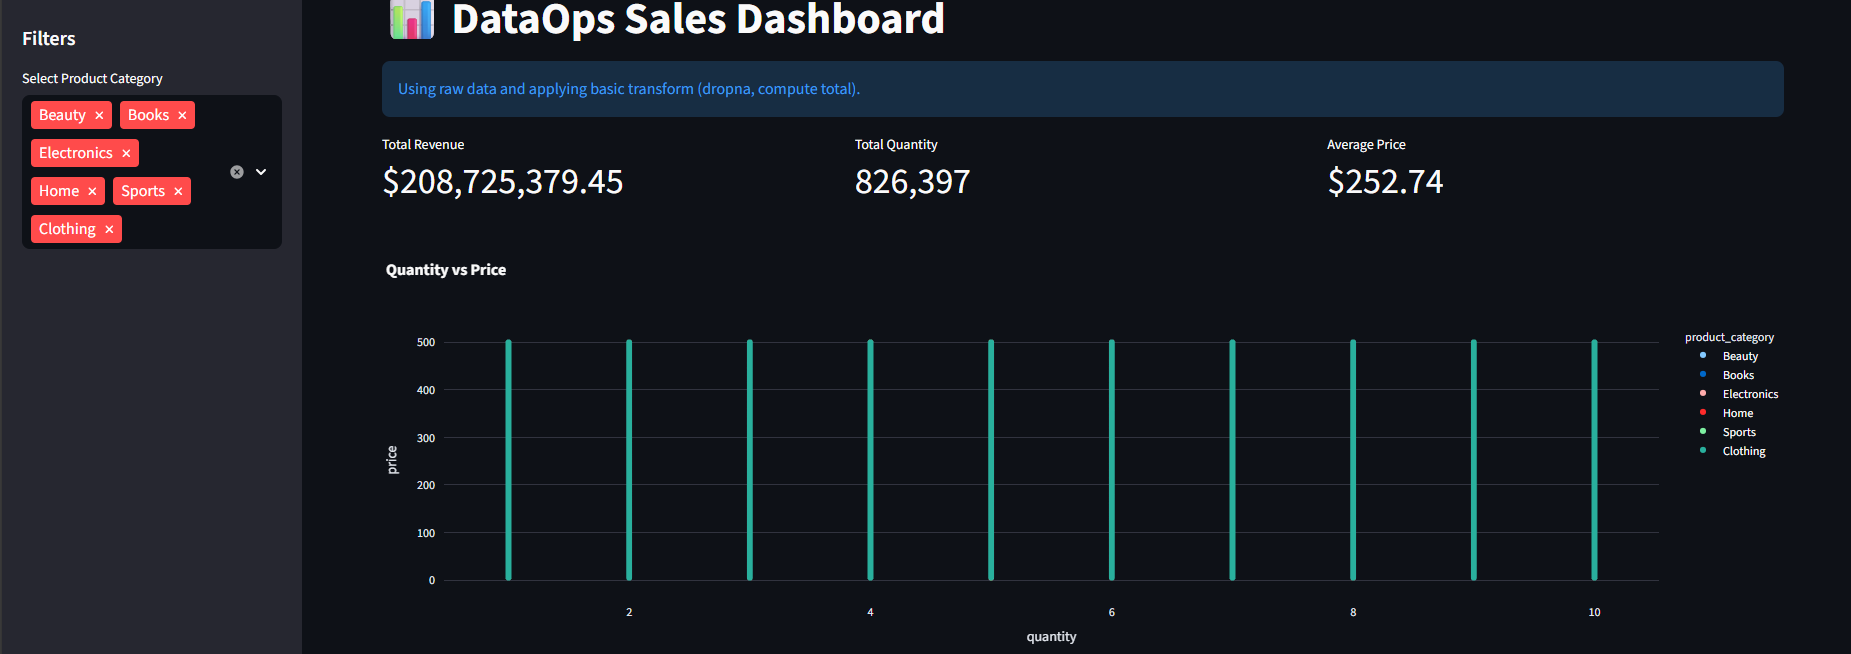
- Interactive Streamlit dashboard with Plotly visualizations for real-time exploration
Technologies
PythonDataOpsPlotlyStreamlitPytestGitHub Actions